
Organizational Network Analytics
We use Organizational Network Analysis, AI Graph algorithms, and advanced analytical techniques to help uncover the backbone of your organization: Your people and their informal networks.
Goal
How
We accompany our customers at every step of the process. Our customers are active participants in the journey. We help you answer questions like: Who are our hidden talents and subject experts? Who are our future potential leaders? How can we measure and increase the impact of our diversity, equity & inclusion initiatives? Who are the key influencers in your organization? Who are the employees at risk for burnout or attrition? How can we optimize our organization to facilitate knowledge exchange, innovation, and collaboration in a hybrid work environment?
What
All your analytics are available 24/7 in our interactive Web platform. You are able to perform your own analysis and discover new insights. Privacy, security and flexibility are the cornerstones of our development approach.
Live demo
See a living network
A fully synthetic organization of 200 people, computed entirely in your browser — the same platform your engagement runs on.
Are you ready to remove the blindfold?
People Network is your organization's "Secret Sauce"
What is Organizational Network Analysis?
A simple network example
Dots represent people — Lines represent collaborations — Colors represent departments
Dots are people, coloured by department. Lines are collaborations. Hover a person to reveal their network.
Helen — Hub — the glue within a department · Paul — Bridge — connects different departments
Influence
Paul & Helen are well connected and together they are able to reach almost everyone.
Bridges & Hubs
But Paul & Helen have a different type of network: Helen is what we call a Hub. She acts as the glue within a department. Paul is a Bridge. He connects people from different departments.
Isolation & Bottlenecks
A network analysis can also help us identify people that are more isolated like Kevin & Lisa. We can also identify who are potential bottlenecks like Paul.
Silos, Diversity & Inclusion
We can detect macro network structure like how siloed an organization is. We can measure how diverse and inclusive the entire organization, a department or a person is.
From Network to Insights
It's like removing a blindfold and seeing how your organization works for the first time.
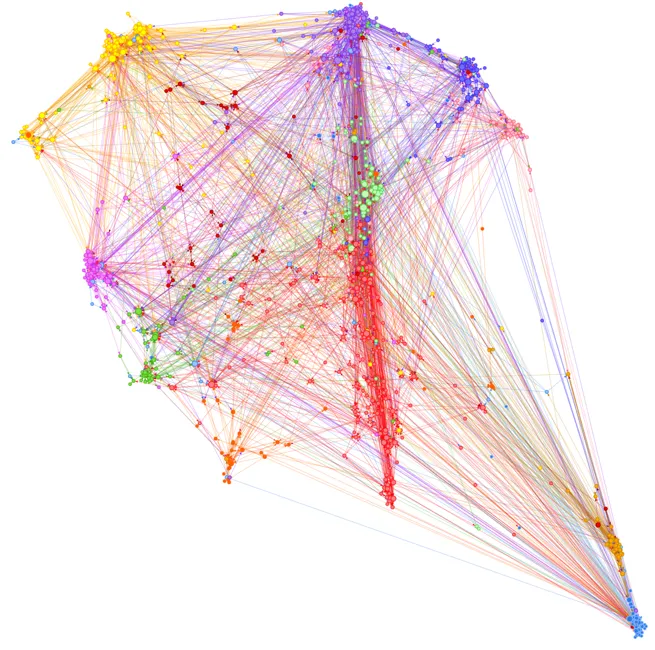
This can be a collaboration network of 1300 people — and at that scale it's really hard to see the Influencers, Hubs, Bridges and Silos. We transform complex network information into meaningful business insights.
Influence Index
Metrics example, department level — comparing network metrics by department
62%
Finance
43%
Marketing
54%
IT
37%
HR
45%
Operations
47%
Global Average
Diversity Index
43%
Finance
52%
Marketing
35%
IT
46%
HR
28%
Operations
34%
Global Average
How do we perform an ONA?
We can perform an Organizational Network Analysis (ONA) in two different ways.
First, we can do an active analysis to ask specific network questions like who do you collaborate with, who do you go to to solve problems, who gives you energy when you work with them, and many more.
We can also perform a passive analysis leveraging data in your collaboration platforms. This can be done dynamically or in batch. We have connectors for Microsoft 365 (email, calendar & Teams), Google Workspace, Slack…
3 simple steps for an active ONA
01 Set Up
With the customer, we define the scope of the analysis and what will be measured. We collect all the data needed including the participants' details & the list of people they can network with.
02 Questionnaire
Participants identify who they interact with and how they collaborate. Depending on the project focus, multiple network questions can be asked. Participants need approximately 5–10 minutes to complete the survey.
03 Analysis
Leveraging advanced organizational network analysis techniques, we perform an extensive analysis of the results, shared via our web platform, with a joint exploration session to highlight the insights.
What you get
Solution Platform
All your analytics are available 24/7 in our interactive web platform — you are in control.
Survey Tool
Manage the questionnaires to gather network information
Edgius Graph Engine
Algorithms & processes to transform network information into meaningful business insights
Insights Visualization
Leveraging Microsoft Power BI to provide access to dynamic business insights
Access, Security & Privacy
Security
Enterprise-grade security powered by Microsoft Azure
Privacy
Privacy flexibility: from open to fully anonymized based on the customer's need
Access
Full access to all data, with an option to host the data in the customer's infrastructure
Going Beyond
Edgius works with a network of experts in multiple organizational fields — Organizational Design; Diversity, Equity & Inclusion; Change Management; Leadership Coaching; Human Resources — combining ONA, coaching & technology with our partners' specialties.